AXP ClaimGraph
Is everything your brand says in public actually consistent?
ClaimGraph builds the official record of what your brand claims, finds every public place that disagrees with it — your pages, PDFs, microsites, third-party listings and AI answers — and ranks the fixes by who’s actually reading. So you fix three things, not six hundred.
Not just old vs new. Anywhere your brand states a fact twice.
Some of it is staleness — a PDF that outlived its own validity. Some of it isn’t: two live pages, updated last week, that simply disagree. Different causes, one result: nobody can tell which version is true.
Live page vs live page
Your product page says one fee; your official charges schedule says another. Both current, both live, never compared.
Section vs section
The main content says one rate; the FAQ three inches below says another. One page arguing with itself.
Owned vs microsite
A campaign site — still live, launched fast and forgotten — states a different number than your main domain.
Text vs schema
The visible page says one thing; the structured data search engines read says another. Nobody checks the markup after it ships.
Text vs image or PDF
A rate-card image or embedded PDF states an old figure the surrounding text quietly corrected months ago.
Owned vs third-party
An aggregator, Wikipedia or partner page states a value you don’t control — and nobody’s assigned to watch it.
So ClaimGraph doesn’t diff documents. It extracts claims, wherever they live, and compares each claim against every other claim about the same fact — regardless of format or age.
The estate got bigger, the readers got faster, and almost nobody is ready.
of leading global brands have a web estate that is NOT AI-ready.
CMSWire, on a study of 270 global superbrands.
of a large brand’s web estate can sit outside the central team’s view.
Old campaign sites, acquired domains, partner pages, hundreds of PDFs.
of documents on a typical corporate site are duplicates of each other.
PDFs are published once, live outside the CMS, and never updated or removed.
The rot was always there. What changed is how many kinds of readers now consume it — customers, search engines, and AI assistants — and how many places outside your own domain now speak for your brand.
When those sources provide inconsistent or incomplete information, creating “signal dissonance,” AI models are less likely to reliably include or accurately represent a brand in their responses.
Consistency is no longer a hygiene task. It decides whether your brand is represented at all.
Every wrong number about your brand is being read by someone
Outdated, contradictory or third-party — same defect, three audiences, one fix. A human might get suspicious at a 2021 date. Nobody, human or machine, can tell which of two live pages is right. Your brand has to tell them.
A customer sees a wrong rate, a wrong price, a dead helpline. Some complain, some buy on the wrong information, some screenshot it.
Google indexes the wrong page, the old PDF or the aggregator — and can surface those numbers in snippets, sometimes above your correct page.
ChatGPT, Perplexity and Gemini fetch your pages and third-party pages alike, can’t tell which value is true, and repeat one as fact.
In your industry, a published claim is a regulated artifact
Lots of products, lots of governed facts per product, quarterly changes, and legal consequences for a wrong published number. That is exactly where consistency breaks first — and costs most.
Six things nobody does today. Together, they’re the product.
Prioritisation is the one that gets quoted — it’s one of six. Any one you could argue about building; all six, running continuously against one graph, is what doesn’t exist anywhere else.
One graph across your whole brand universe
Every claim from every surface — pages, PDFs, videos, microsites, acquired domains, profiles, aggregators, Wikipedia and the AI answers quoting all of it — in a single graph.
Your own approved Knowledge Hub
One schedule of charges can carry 245 figures in 8,000 characters. We read them like an analyst — fonts repaired, tables parsed, crore vs million normalised — into a structured, versioned, exportable record.
Continuous AI-answer surveillance
Your agreed prompt set runs continuously across ChatGPT, Perplexity, Gemini and AI Overviews, captured with dates and screenshots, every cited source traced back into the graph.
Discovery of the estate you forgot
Archived microsites, acquired domains, off-sitemap URLs, the /downloads nobody owns. We start from your CDN logs and the sources AI cites — not the sitemap every other tool starts from.
A severity & prioritisation engine
priority = how bad the conflict is × how many people and machines are reading it × how recent it is. The result isn’t a report; it’s a ranked to-do list.
Precision that survives real content
Qualifier-aware detection so legitimate variation is never flagged, zero false alarms on a 22-trap set, and a suppressed tab showing everything we chose not to flag, with reasoning.
Four layers of input. One graph.
Layer four is the loop-closer: when an AI answer quotes a wrong number, we trace it to the source, and that source enters the graph with an action attached.
Owned content
Your URLs, PDFs, videos (via transcripts), uploaded documents, acquired domains, old microsites.
Controlled profiles
Your listings on rented surfaces: Google Business Profile, LinkedIn, app stores, aggregator pages you manage.
Third-party mentions
Wikipedia, media, review sites, comparison sites and aggregators describing your brand.
AI answers
Tracked prompts across ChatGPT, Perplexity, Gemini and AI Overviews — what they say, and which sources they cite.
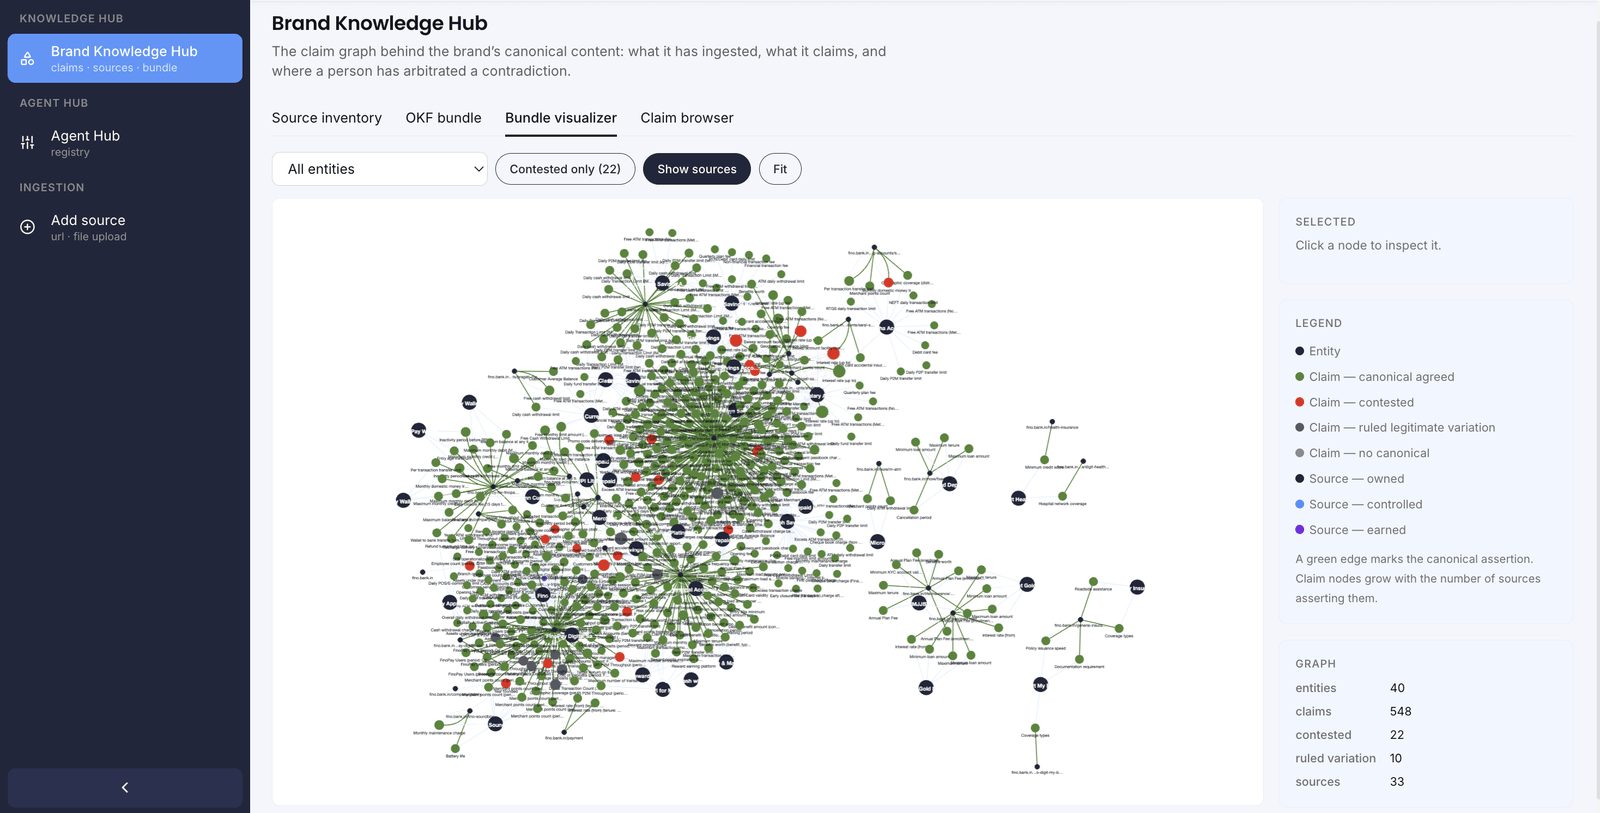
The atomic unit is a claim
For every claim, one value is canonical — the official one. The system proposes it automatically; a human can override it in ten seconds, and every override is logged.
What you end up owning is a structured, versioned record of everything your organisation officially claims. It exports as a portable markdown bundle (Open Knowledge Format), survives agency changes, and is an asset — not a report.
Every finding names the exact offending sentence
“Expired, still read” isn’t wrong — it’s being read as if it were current, a distinction you can only make if you know who’s reading. And “contradiction” isn’t only about old content: two pages updated last week can disagree.
Contradiction
Two live sources — or two sections of one page — state different values for the same fact. Nothing needs to be old.
Outdated
An old source overtaken by a newer official one.
Expired, still read
A document past its own validity date that people and machines still land on.
Duplicate
Near-identical documents competing for authority.
Third-party divergence
An aggregator, Wikipedia, partner or review site states something different about you.
AI-answer divergence
An AI assistant states a wrong value in a live answer, traced to the source it cited.
Contradicted Exposure Share (CES)
The share of total reads on your estate — human pageviews + search-bot crawls + AI-agent fetches — that landed on a document contradicting your official claims. It comes from your own logs, and it moves only when content actually changes.
From your own logs
No third-party API, no attribution argument.
Covers every audience
Wrong content read by a customer counts too — not just an AI story.
No gaming the number
A “fixed” finding the next sweep still detects reopens as a regression.
Content nobody in your team reads. Everyone else does.
Reference estate · machine reads vs human views, 90 days“Fifteen people read that page last quarter. Machines read it four and a half thousand times. Who is that content working for?”

Now find out what your own estate is saying
You’ve seen how the score is built and what a finding looks like. Leave your email, name one product line, and we’ll come back with your own baseline.
- Your baseline Contradicted Exposure Share for the product line you name
- The top contradictions we find, each pinned to the exact offending sentence
- Whether the cause is an old document, two live pages disagreeing, or someone else getting you wrong
AXP ClaimGraph Offering
Ingest anything, build the official record, browse every claim, detect what disagrees, and adjudicate down to the sentence.
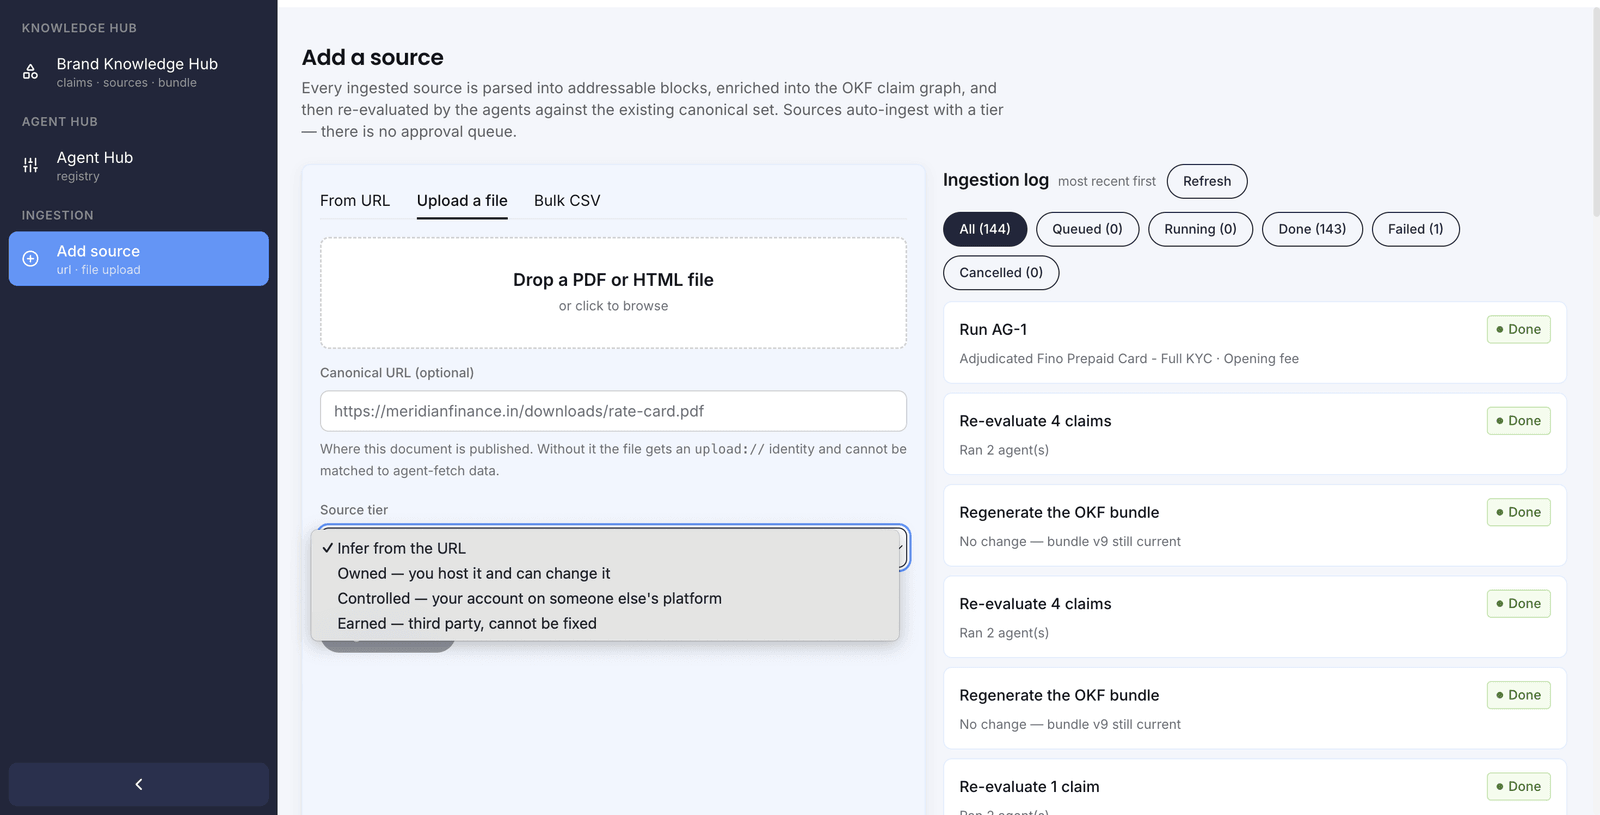
Point it at anything
Paste URLs, drop PDFs, add video links — or let discovery pull from your CDN logs, sitemap and crawl. Every source is parsed into addressable blocks and auto-ingested. No approval queue.
URL · PDF · CSV · bulk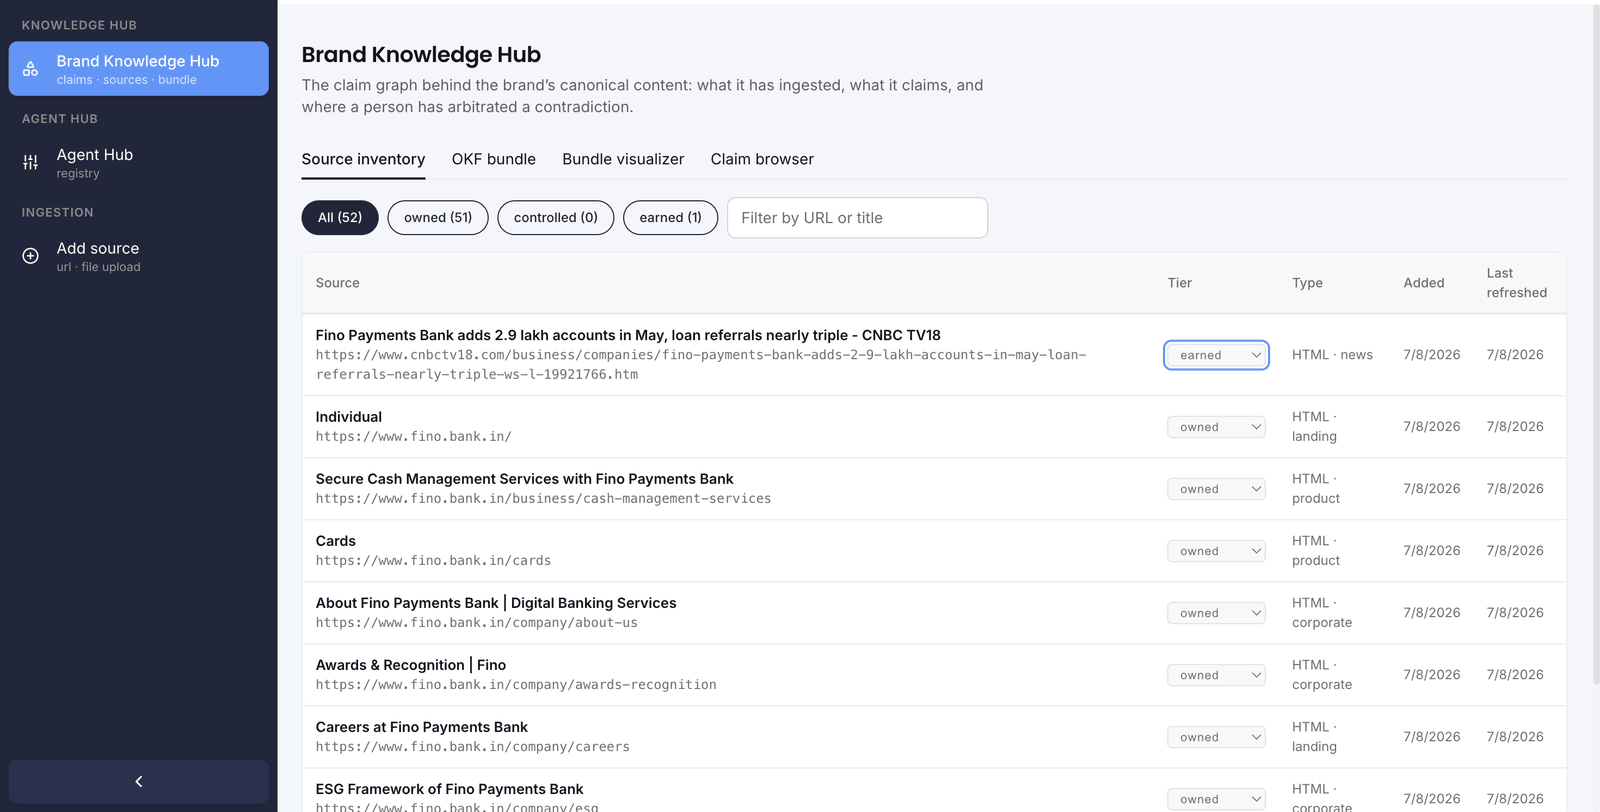
One inventory of everything you publish
Every source in one place, tagged owned, controlled or earned — so a third-party page can inform the graph but can never be the official value.
Owned · controlled · earned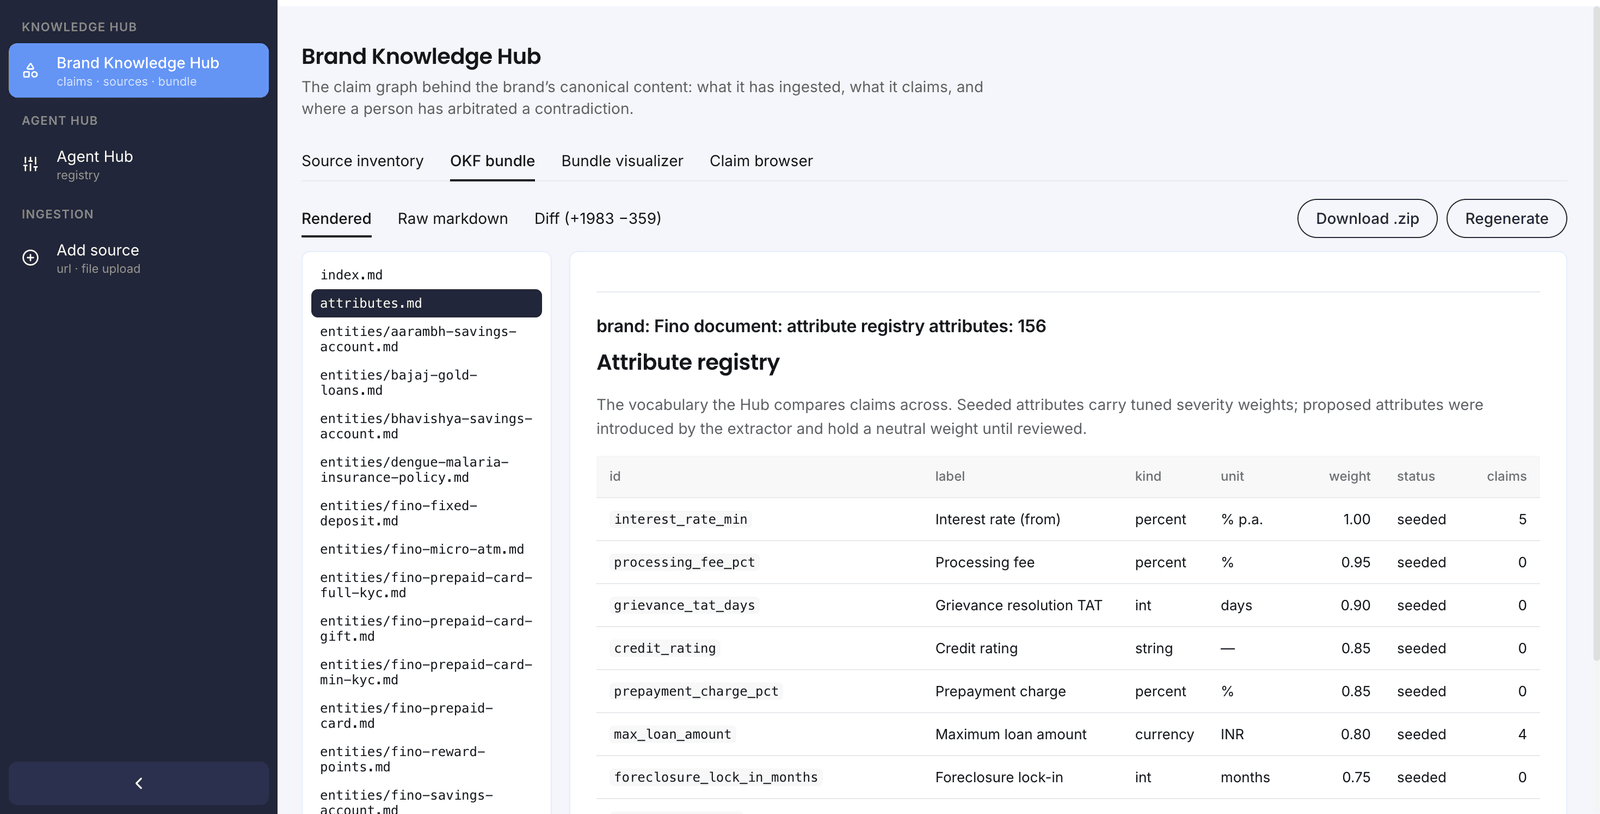
Your official record, versioned and yours
The claim graph exports as a portable Open Knowledge Format bundle: a governed attribute registry with tuned severity weights, diffable month over month, downloadable, and yours to keep.
156 attributes · export .zip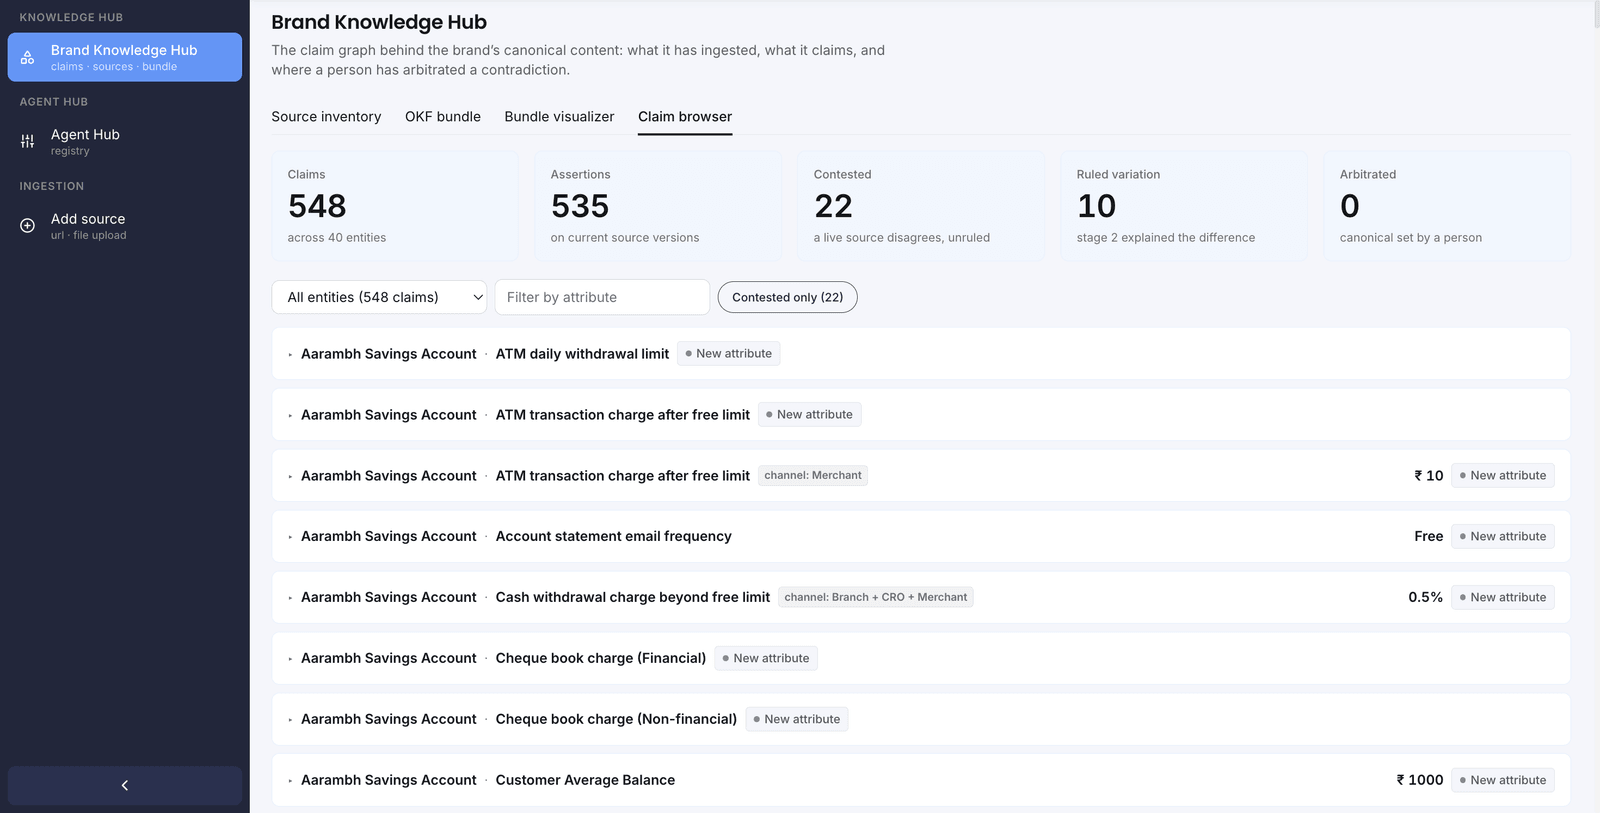
Every claim, with its qualifiers
Browse each governed fact across every entity — segment, channel and geography attached — so legitimate variation is never mistaken for a contradiction. Filter straight to what’s contested.
548 claims · 22 contested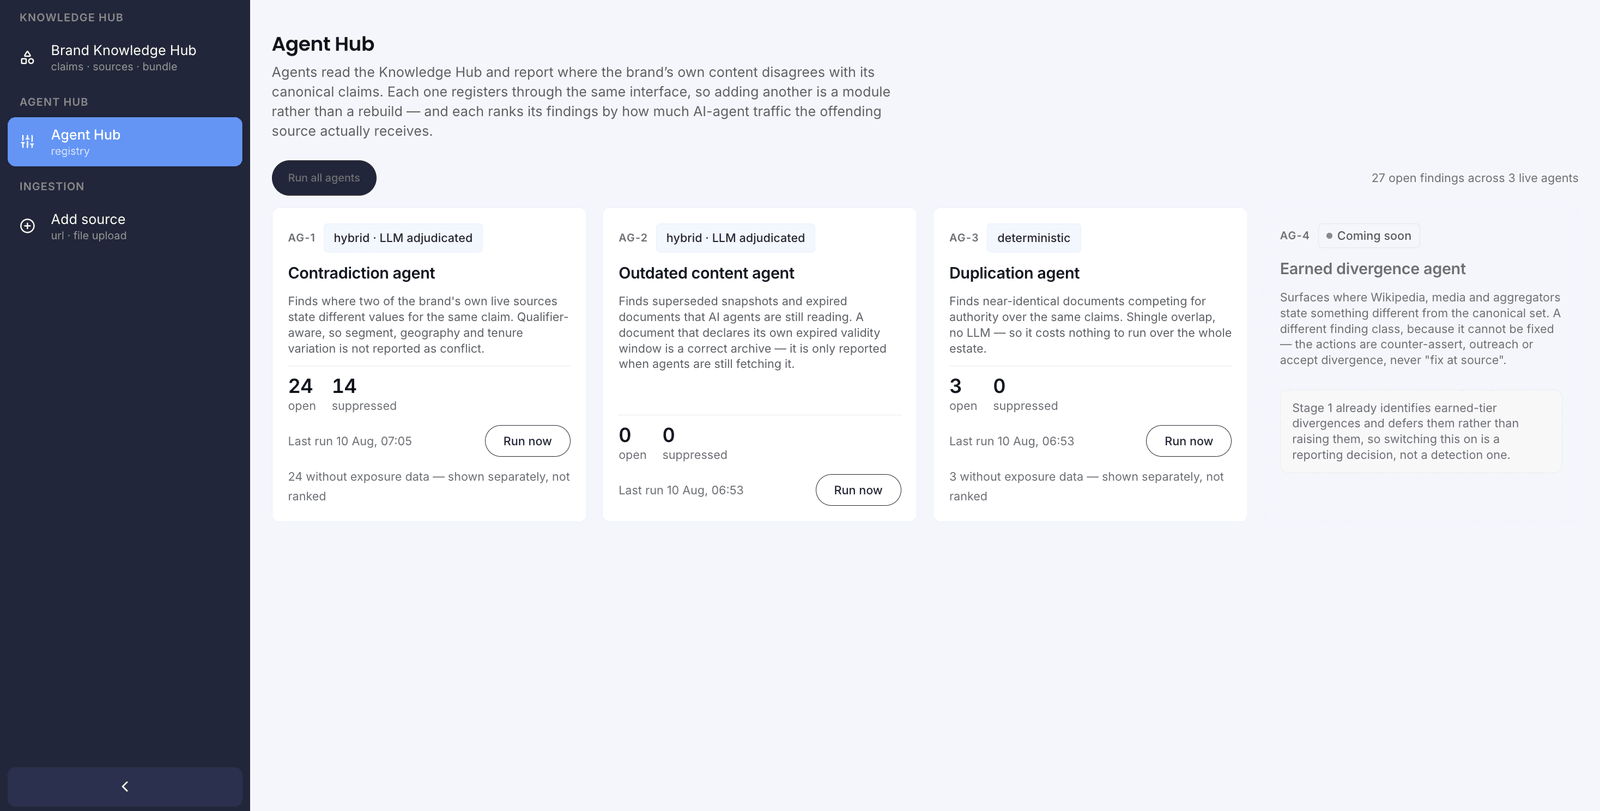
A registry of agents, not a black box
Each agent reads the Knowledge Hub and reports where your own content disagrees with its canonical claims — contradiction, outdated, duplication — registering through one interface, so adding another is a module, not a rebuild.
27 open findings · 3 live agents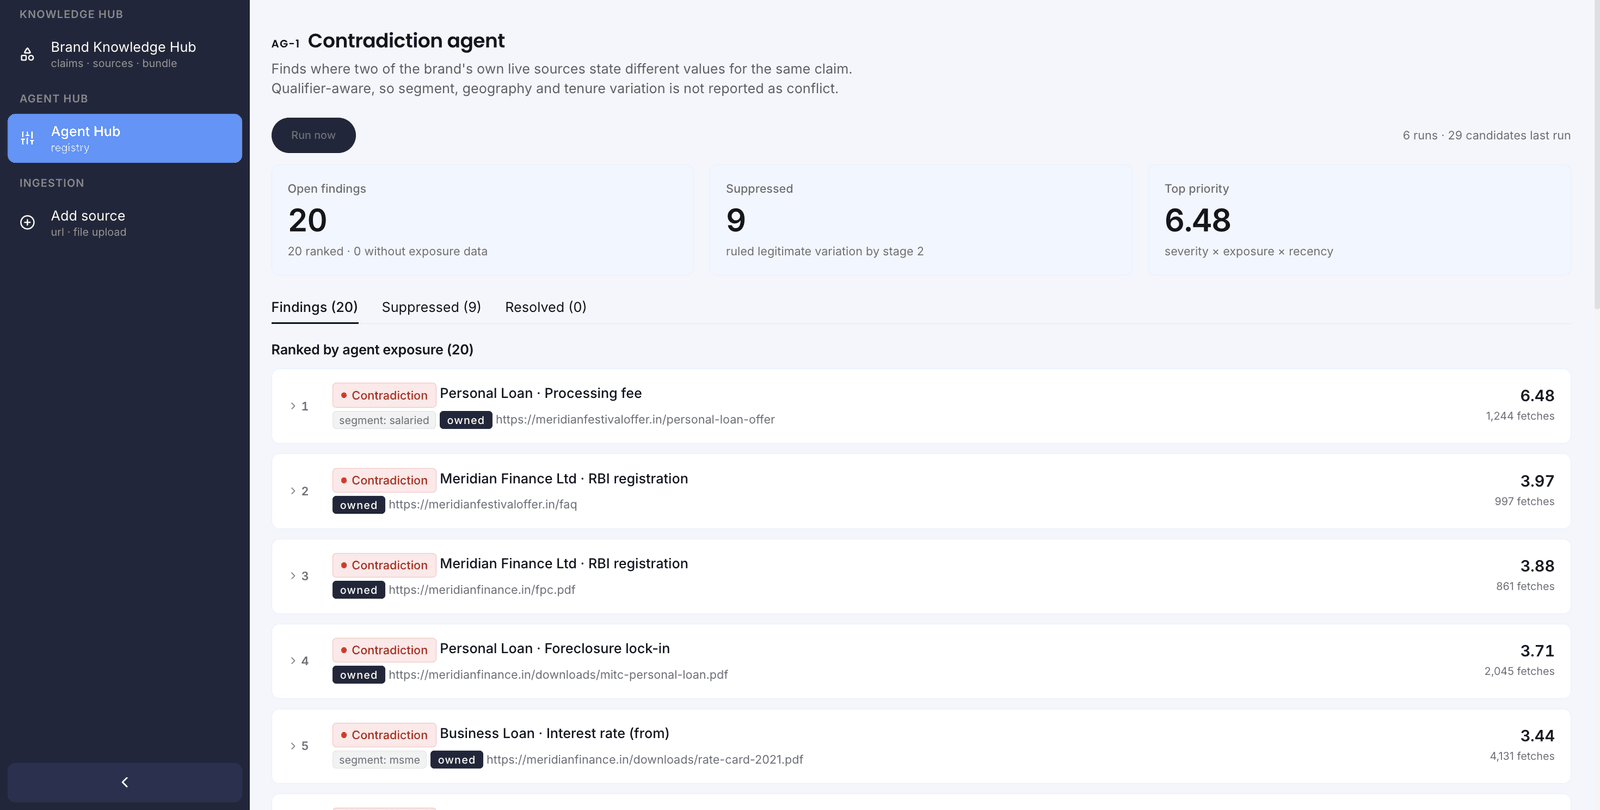
A queue ranked by who’s reading
Findings arrive ranked by priority — severity × real readership × recency — with a suppressed tab showing everything ruled legitimate variation, and why.
priority = severity × exposure × recency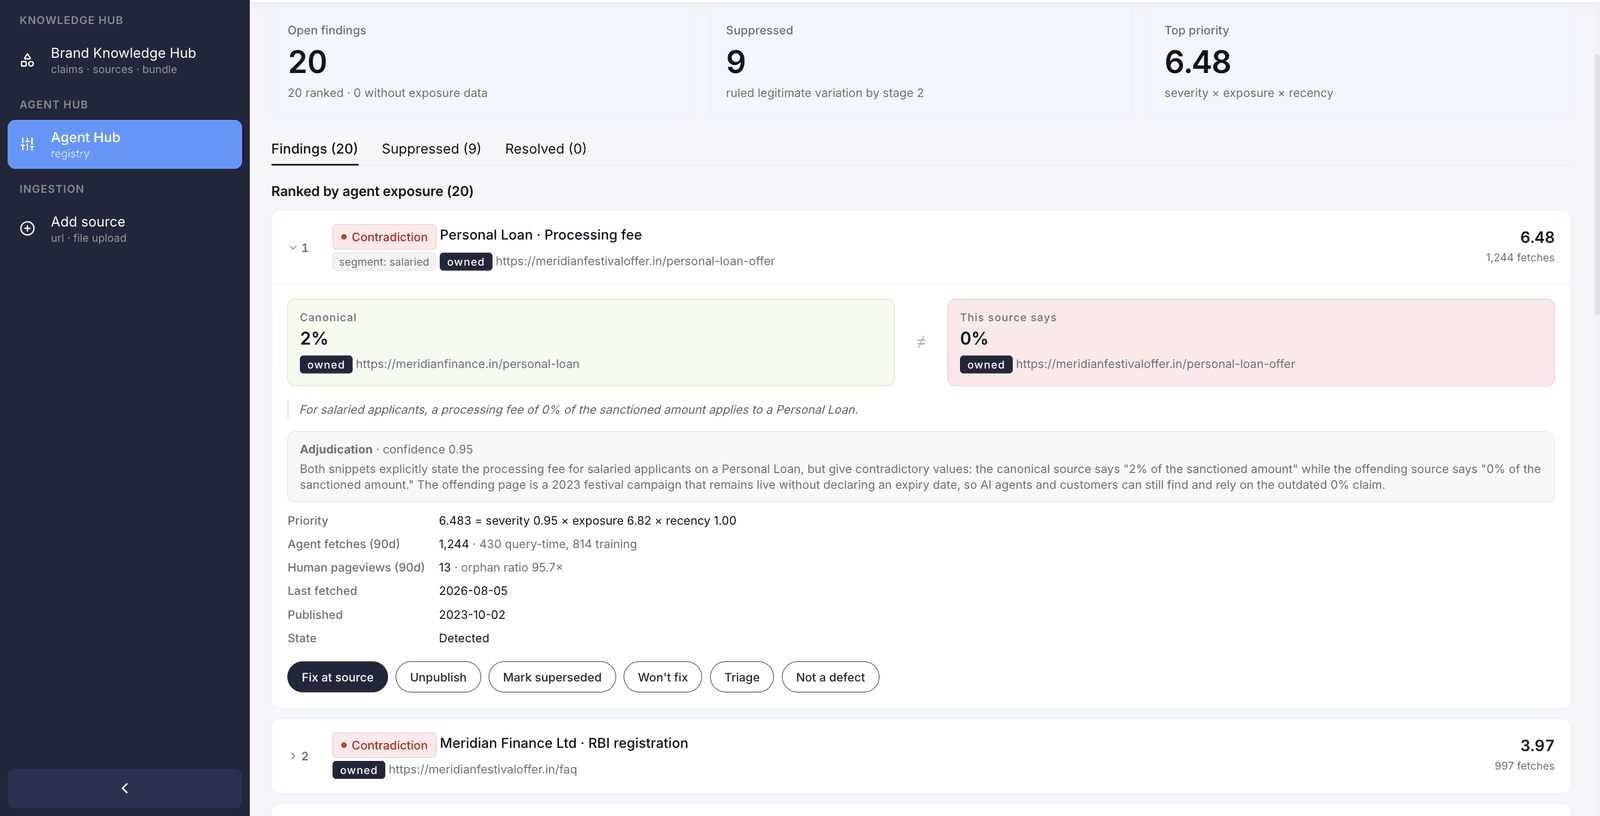
Down to the offending sentence
Each finding shows the canonical value beside what the source says, the exact quoted sentence, plain-English adjudication, the orphan ratio, and only the actions you can actually take.
canonical vs source · with actionsBefore, and after
Three products. One platform. Every audience.
Edge makes you readable. Streams makes you present. ClaimGraph makes you correct — and correctness is the precondition for the other two.
AXP Edge
Machines get a clean, efficient view of your pages.
Explore AXP EdgeAI Streams
New content built to answer the questions your buyers ask.
Explore AI StreamsAXP ClaimGraph
The official claim record, and continuous surveillance of everywhere the public record disagrees with it.
Priced to the size of your estate
ClaimGraph is priced on the complexity of your knowledge graph — entities, governed facts per entity, and sources under management — not on seats or page counts. Most teams start with a paid diagnostic that runs the method against your own estate and returns your baseline Contradicted Exposure Share.
Start with the snapshot, not the statement of work
Get your baseline Contradicted Exposure Share first and see what is actually out there, before anyone scopes your estate.
The questions serious buyers ask us
An audit gives you six hundred rows sorted by severity, and nobody works it. ClaimGraph gives you a queue where rank one is the contradicted claim your customers, Google and AI assistants actually read most last quarter. Same detection, a completely different artifact: a ranked to-do list, not a spreadsheet.

See what your brand is really saying in public
Tell us your domain and one product line. We’ll come back with your baseline Contradicted Exposure Share and the top findings — whether the cause is an old document, two live pages disagreeing, or someone else getting you wrong.